
Simplifying ggplot scaling and proportions
I used to make data visualizations for a weekly Twitter event called Tidy Tuesday, graphics like this one:
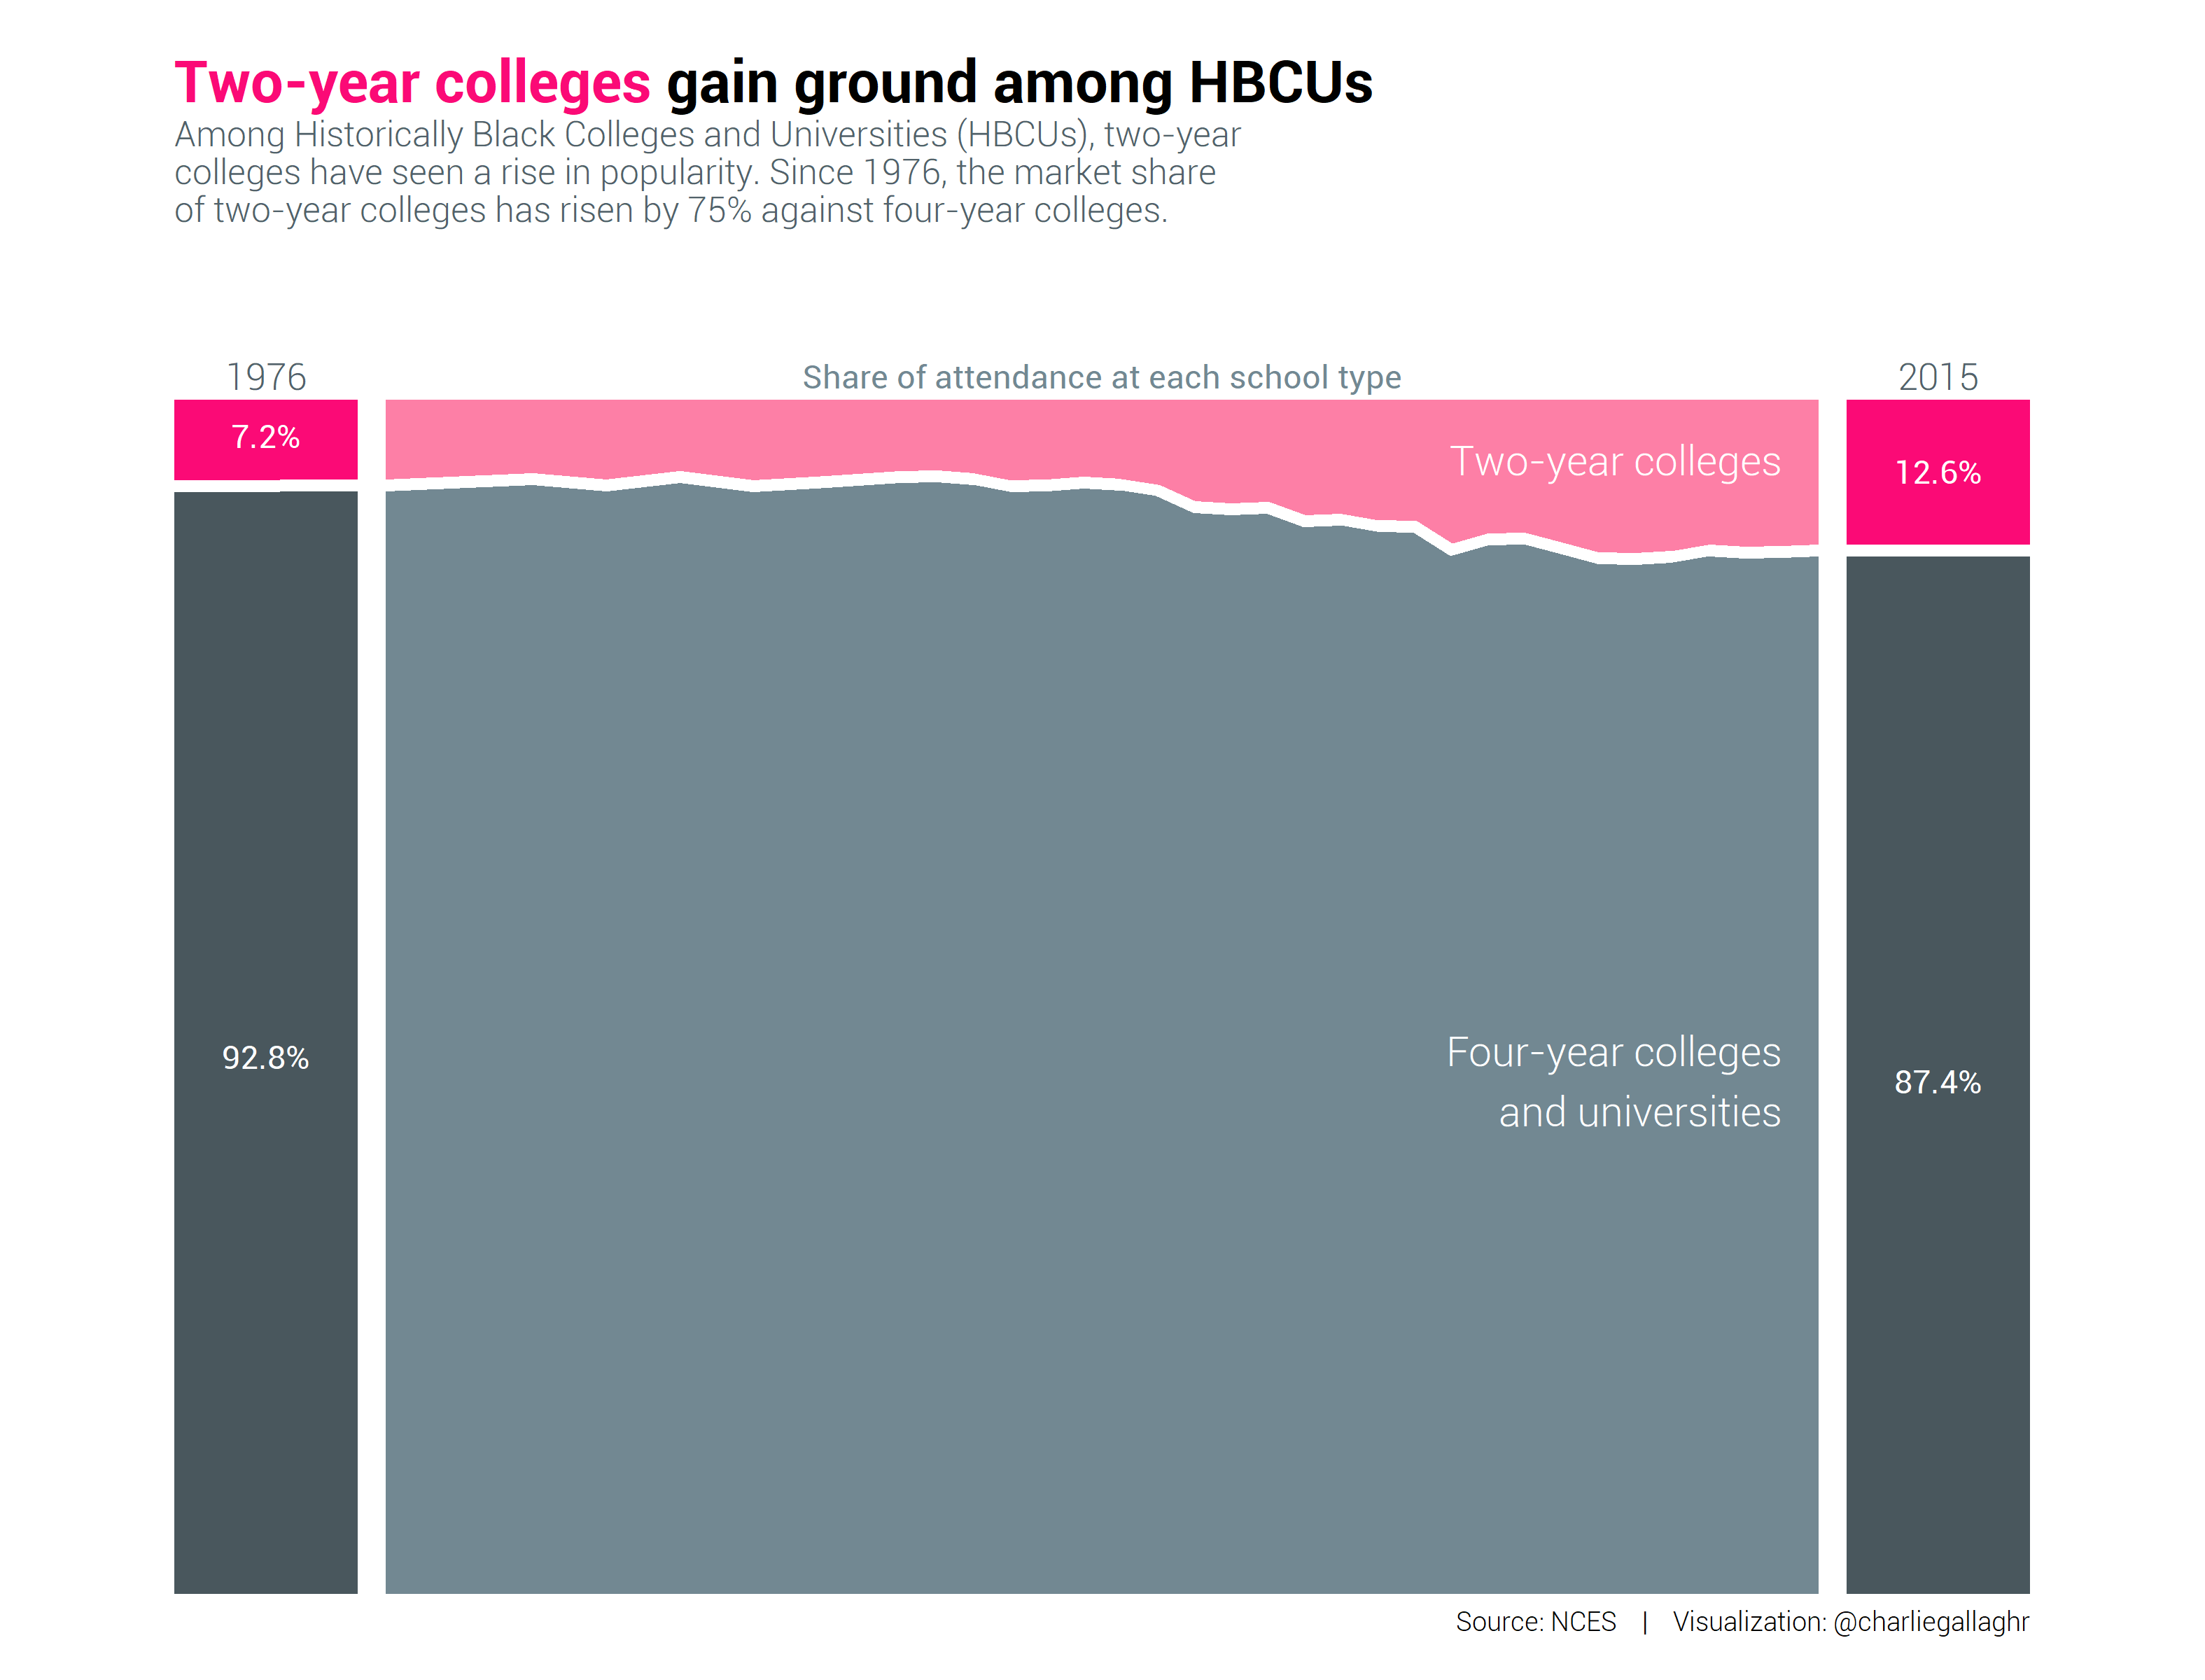
After a few dozen weeks of making graphics, I was comfortable with the mechanics of ggplot, but I spent a lot of time getting all of the elements into harmony and then getting them to print correctly to the graphics device so they would have a pleasant resolution. And always hot on abstraction, I also wondered if there wasn’t a way to integrate proportion and scaling, to have a framework for thinking about them more simply.
Thomas Lin Pederson helped make dpi more or less irrelevant. He wrote an
excellent post called Taking Control of Plot
Scaling to
introduce the scaling argument for ragg graphics devices. He assumes that
you have your plot proportions where you want them, and you only need to scale
the graphic for a particular absolute output format (web, poster, etc.). With
the scaling argument, you can increase and decrease dpi seamlessly, and that
frees you to focus on relative proportions.
Configuring proportions is straightforward in principle – set the title size to 2x the axis text size, and so on. But it isn’t clear what the unit should be.
I found inches, millimeters, and points to be faulty. Inches are too coarse – it takes too many decimal places to accurately describe e.g. the width of a thin axis line. Points and millimeters have the right resolution, but they’re too closely tied to the absolute size of the graphic. It bridges proportion and scaling unnecessarily. To anchor proportions, you need a unit that is a graphical element itself, so that regardless of the resolution, the proportions are well-defined.
I chose to measure all plot elements relative to the height a line of body text, what designers call “lines”. If you have a sense that the thickest line in the graphic should be no wider than a half line of text, you set it to a height of 0.5 lines. The title could be 2x the line size and subtitle is maybe 1.5x, for example.
I’ve found lines to be basically magic for defining relative proportions in graphics – not too fine, not too coarse, and easy to reason about. In most graphics, axis text is the smallest text that should still be readable, and it occupies a kind of middle position among the elements. Titles and certain plot elements are somewhat larger, axis lines and ticks are somewhat smaller. Often, the height of the graphic falls comfortably into the range of 25 to 45 lines.
Unfortunately ggplot makes relative proportions difficult because it mixes
default units: points for theme elements (via the base_size argument),
millimeters for plot elements (including plotted text!), and for some special
elements like arrows, you must specify the units yourself. Making a
comprehensively proported graphic is a discipline – remembering the default
units used everywhere, setting defaults to a specific value, and then making the
proportional choices on top of this.
I wrote an R package called
ggunit a few years ago to make
things a little more cohesive. ggunit works in terms of three variables:
- Line height in points
- Number of lines that should fit into the graphic vertically; with line height, this defines the scale of plot elements
- Aspect ratio
Graphic resolution is configurable but treated as incidental.
When you’re building a new ggplot, all plot elements are sized using the line
height as the unit. You still need some knowledge of ggplot’s text vagaries, and
then you can use e.g. the mm() conversion function to convert millimeters to
line height (defined in points).
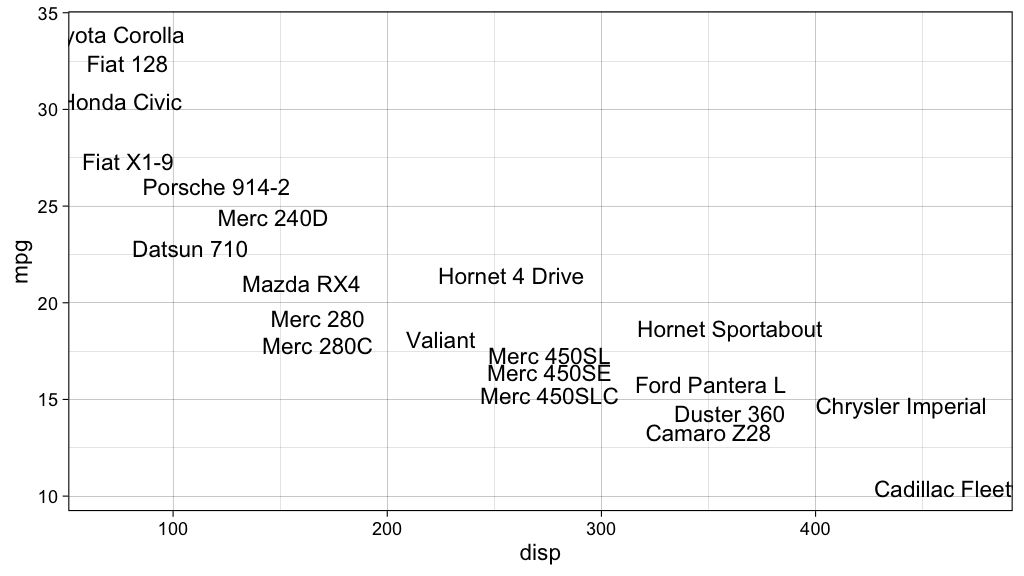
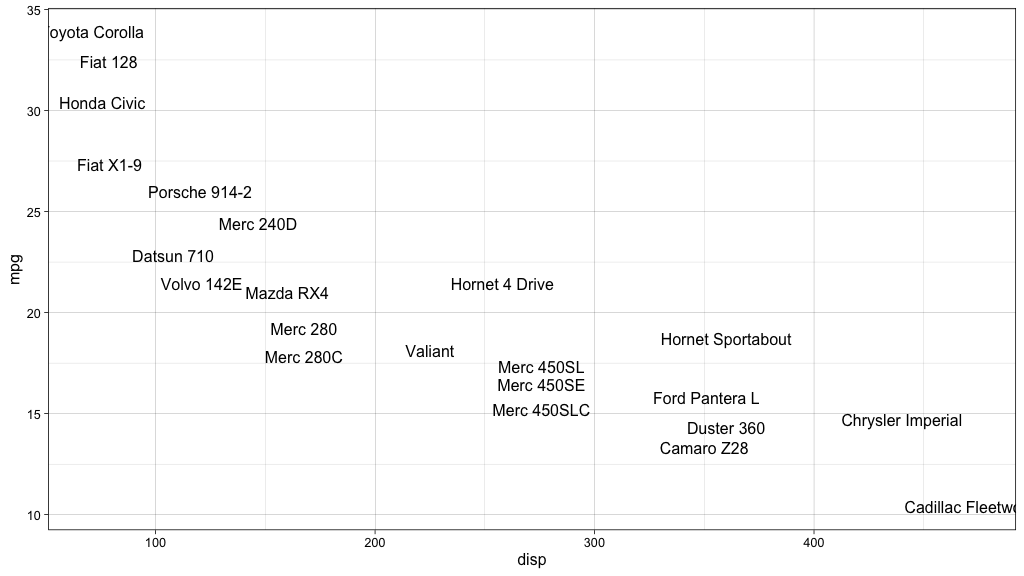
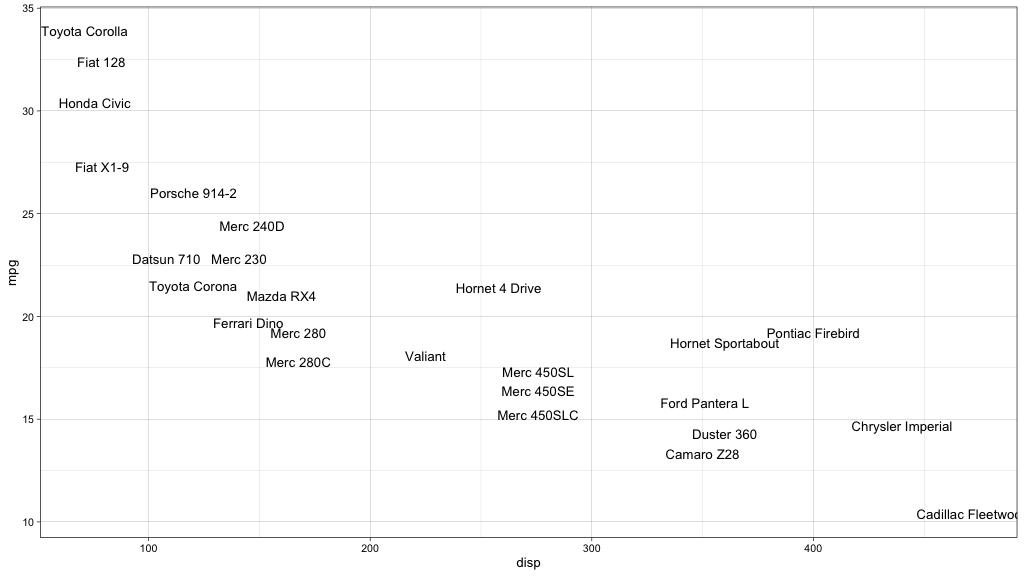
With some work, you can define most of the relative proportions of things, and by adjusting the number of lines that fit in the graphic vertically, you can adjust the sense of scale of the elements. As you increase a graphic from 25 to 35 to 45 lines tall, you see the elements get smaller while staying in harmony.
25 lines
35 lines
45 lines
ggunit worked for me at the time. I collaborated with a few other analysts on
a data newsletter, and it was much easier to say “Could you give this to me as a
45-line graphic instead?” than to say “Could you scale everything down by 12% or
so? Or maybe 10%?” It’s hard to guess percecnt scaling, but I could eyeball a
45-line graphic at a hundred yards. And if all graphics were set at the same
height and aspect ratio, then the newsletter had a better sense of harmony.
The package is clunky. I believe I could’ve done more to help the user remember which arguments use which units, for instance, and the conversion functions are a bit confusing. But it’s a statement about how you can fix graphical proportions in ggplot, at least for us who spend too much time pushing pixels.
If you’ve got a better idea for an API, I’d love to hear it.